The never-ending question if you are a real estate property owner is “What’s going on with the market?” While none of us have a crystal ball, we can rely on historical data to get an idea of what trends we are seeing.
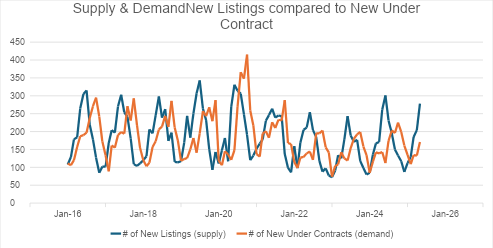
In the chart below, you will see a comparison of the Number of New Listings (shown in Blue) compared to the Number of New Contracts (shown in orange). This is our way of viewing Supply & Demand for our area. This chart reflects all residential properties (no vacant land) throughout Summit County Colorado with data going back to 2016. As you can see, our inventory always peaks in the summer months, but what we are really focusing on is the amount of inventory compared to the number of buyers purchasing property.
To drill this down a bit more, I took a look at what our first 5 months of 2025 looked like compared to previous years. This graph reflects that data:
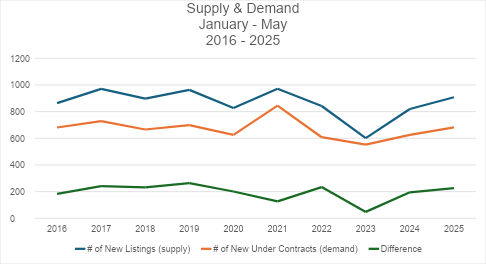
In this table, let’s look at the green line. That is the difference between the number of new listings compared to the number of properties that went under contract. As you can see, we are at a similar level to where we were from 2017 – 2019, which were still considered a Seller’s market, just not as strong as we saw from 2021 – 2023.
The Supply & Demand will also affect the Days on Market. The following table demonstrates how Median Days on Market has fluctuated annually since 2016 with the dark blue line representing the percentage over/under list price and the teal line providing us with the median number of Days on Market for each year.
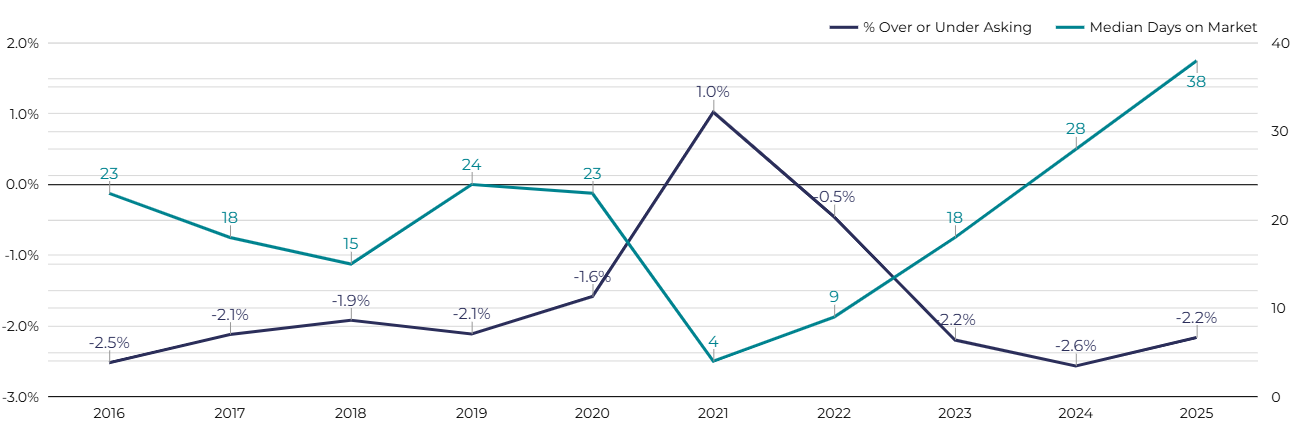
The teal line reflects what most of us in the industry are feeling right now – it has been a SLOW spring. Our cool temperatures and on-again/off-again snow days have kept people from visiting the County in May.
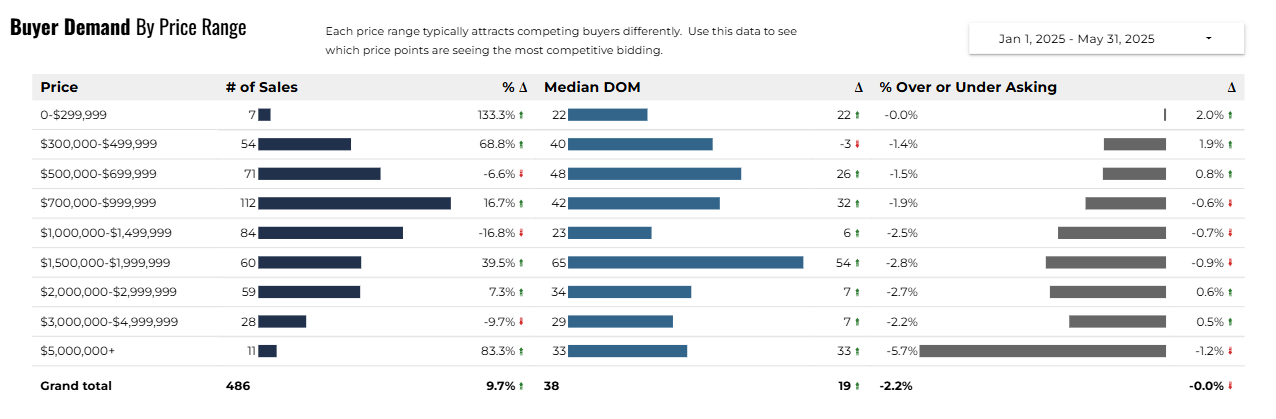
I find this final graph helpful as we determine pricing. This graph shows you the number of sales at various price points, the Median Days on Market, and the Sales Price to List Price percentage for the first 5 months of 2025. We will utilize this to determine the level of demand and therefore guide us in how much we can push a price on a home.
Only time will tell us what our real estate market in Summit County will look like this year, but the general feeling is that it will continue to be a bit slower than what we’ve become accustomed to, and homes will be on the market longer.
What Does This Mean for Sellers?
If you are selling your Summit County home this year, pricing becomes VERY important. Listing at a high price thinking that someone will just bring a lower offer doesn’t work. Homes that are initially overpriced typically sit on the market much longer than homes that are priced well to begin with. Buyers and their agents are looking for homes that are priced well – and then they will negotiate on that. They are not going to waste their time on a home that is significantly overpriced because they will believe the seller and their agent are unrealistic to begin with so will likely not be willing to negotiate to an acceptable price.
Nelson Walley Real Estate has developed a comprehensive method for pricing homes taking into consideration 11 major factors that affect the price. Call us today if you are considering selling your home and let us tell you what we feel your home is worth.
What Does this Mean for Buyers?
If you are in the market to purchase Summit County property, now is a good time! Your ability to negotiate is stronger than it has been in recent years. Nelson Walley’s seasoned agents stay abreast of the market and will use our pricing strategy to make sure that you are not overpaying for a home.
Whether you are buying or selling in Summit County, Colorado, call Nelson Walley today for expert guidance on your next real estate move.